Vacation Rental Market Report Boston: 2026 Data and Trends
This vacation rental market report Boston owners and investors can use starts with five metrics: occupancy, average daily rate (ADR), RevPAR, active listing supply, and seasonality. AirDNA’s current Boston data puts average annual occupancy at 62% and ADR at $332, a reasonable baseline for 2026. At South End Hospitality Rental Management, we run vacation rentals and boutique hotels across Greater Boston, so we read these numbers as operators.
Key Takeaways
- Boston’s active short-term rental supply fell 4.3% year over year through June 2026, and RevPAR fell 5.0% over the same stretch, according to AirDNA.
- Boston city figures and Greater Boston regional figures are different datasets, so label the geography and reporting window beside every number.
- Greater Boston monthly occupancy runs from 52% in January to 75% in July and August, so a single annual average hides a wide swing.
- Boston, Cambridge, and Brookline each run separate short-term rental rules, and Massachusetts adds a room occupancy excise tax on top.
- Average short-term revenue and average long-term rent are not directly comparable because unit mix differs; compare equal bedroom counts before choosing a strategy.
- Visitor volume to the Boston region remains large, which anchors demand for both hotels and rentals.
A market report earns its keep when it changes a decision: whether to buy, or how to price Marathon weekend. It also helps decide whether a unit should run as a short-term or a mid-term or long-term rental. Most pages that rank for this search blur long-term rent data with short-term performance data, or quote one provider’s figure without saying what it measures. This guide separates those threads.
We write from the operator’s side. South End Hospitality manages properties in Boston, Cambridge, and Gloucester, so each section ties a data point to a pricing, compliance, or operating choice. Every figure carries its source and, where the source gave one, its reporting period. Figures reflect mid-2026 data and shift monthly, so verify before you underwrite.
What Does a Vacation Rental Market Report for Boston Show in 2026?
A Boston vacation rental market snapshot is a dated set of supply and performance metrics for short-term rentals operating in the city. As of June 2026, AirDNA’s Boston data counts 3,326 active listings across Airbnb, Vrbo, and Booking.com, fewer than a year earlier. Entire homes make up most of that supply, and one-bedroom units dominate the size mix.
| Metric | Figure | Source and period |
|---|---|---|
| Active listings | 3,326 | AirDNA, June 2026 |
| Average annual occupancy | 62% | AirDNA |
| Average daily rate | $332 | AirDNA, trailing 12 months through June 2026 |
| Annual revenue per active listing | $33,700 | AirDNA, same trailing period |
| RevPAR | $179 | AirDNA |
| Seasonality score | 56 out of 100 | AirDNA |
| Entire-home share of supply | 82.7% | AirDNA |
| One-bedroom share of supply | 68.3% | AirDNA |
| Hotel occupancy, 2026 | 77.7% | City of Boston FY27 report |
The availability split matters for investors. More than half of Boston listings (53.5%) are open 271 to 365 nights a year, which points to operator-run inventory rather than occasional hosting. You are pricing against professionals.
Zoom out to the state and Boston ranks among the municipalities with the largest number of registered short-term rentals, after Nantucket and Dennis, according to the Massachusetts report on seasonal homes and short-term rentals. That report shows traditional lodging revenue growing 8% between FY2023 and FY2024, while short-term rental revenue grew 35%.
Why Do Boston Short-Term Rental Data Providers Report Different Numbers?
Data provider variance is the gap between short-term rental figures that different analytics sources publish for the same market. Four things cause most of it: geography, platform coverage, the definition of an active listing, and the time window. Even within AirDNA, the overview page reports 60% occupancy and a $324.60 ADR. The seasonality and revenue pages report higher figures, which typically reflects different trailing windows.
Other analytics providers describe Greater Boston rather than the city alone. One such series shows Greater Boston occupancy of 65.3% in 2026 and 65.2% year to date through September 2026, with a $231 ADR. In September 2026, entire-home listings reached a $329 ADR against $264 across all listing types.
Check whether a figure is a mean or a median, too. Averages let a few high-earning listings pull the number up, and a median tells you more about the listing you are likely to own.
At South End Hospitality Rental Management, owner-focused reporting starts by writing the geography and window beside every number, then comparing against the same bedroom count. A citywide average that includes shared rooms will understate what a three-bedroom Jamaica Plain apartment can earn. A regional average will not describe a one-bedroom hotel-style suite in Fenway either.
How Seasonal Is Boston Vacation Rental Demand?
Boston vacation rental seasonality is the month-to-month swing in occupancy and nightly rates across the year. AirDNA gives Boston a seasonality score of 56 out of 100, which signals demand that is not steady year-round. Greater Boston monthly occupancy runs: January 52%, February 60%, March and April 65%, May 68%, June 72%, July and August 75%, September 72%, October 74%, November 58%, and December 53%.
Two details stand out. October nearly matches midsummer, and November drops 16 points from October. The November to February trough is where a fixed nightly rate costs you the most, because you either sit empty or discount blindly.
A dedicated revenue manager earns their keep here by watching booking pace and the event calendar, which includes Marathon weekend, graduation season, and Red Sox homestands. AirDNA’s seasonality page defines occupancy and RevPAR clearly if you want to check your own math. Industry sources report that dynamic pricing lifts vacation rental revenue meaningfully, though your result depends on your starting point.
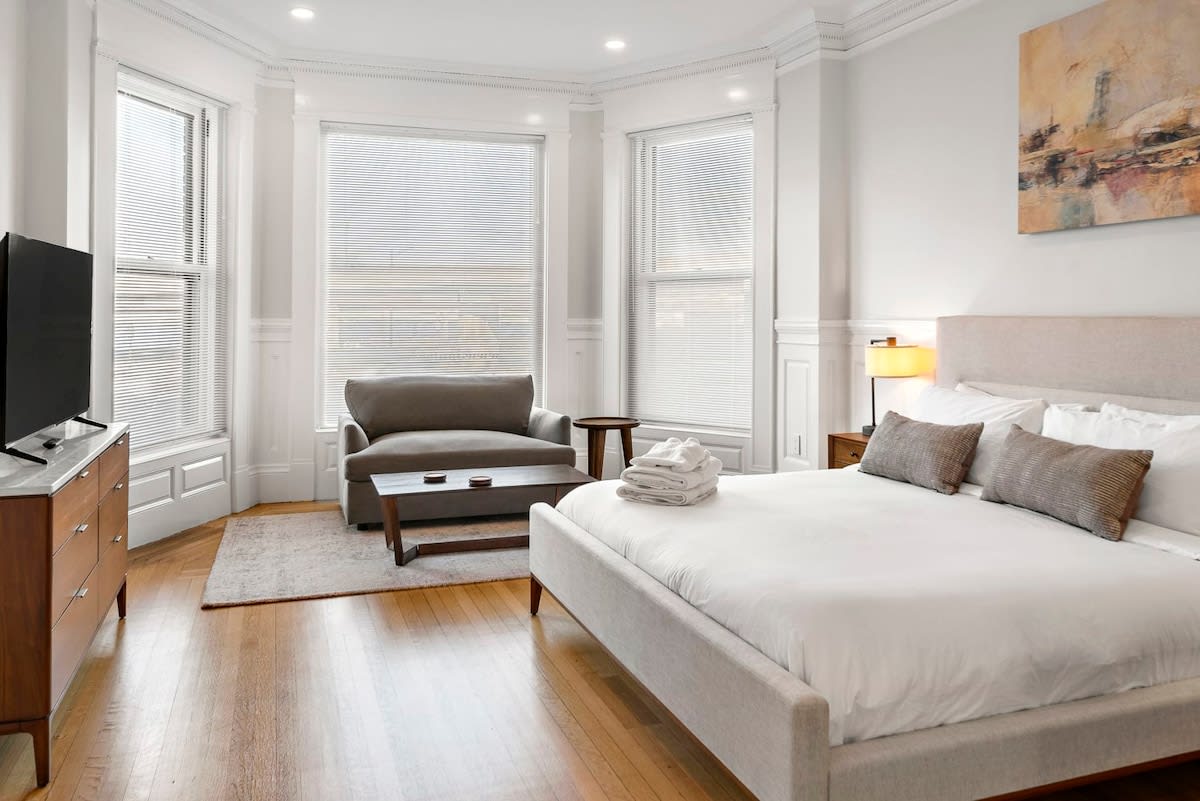
Location sharpens the pattern. Charlesgate Suites: Premier Oversized One Bedroom sits about 0.3 miles from Fenway Park, roughly an 8 minute walk, so homestands are a natural pricing input for that unit. Confirm game and event dates with the organizers before you price them.
Which Boston Neighborhoods Drive Short-Term Rental Demand?
Neighborhood demand in Boston follows what sits within walking distance of a unit: stadiums, universities, hospitals, transit, and waterfront. Neighborhood-level occupancy and ADR for Back Bay, the Seaport, the South End, Jamaica Plain, and Allston generally sit behind paid datasets, and we will not publish figures we cannot source. What we can show are the demand anchors around the addresses we operate.
| Area | Demand anchors | Example stay |
|---|---|---|
| Fenway and Kenmore | Fenway Park about 0.3 miles; Boston University about 0.5 miles | Charlesgate Suites: Premier Oversized One Bedroom |
| South End | Symphony Hall about 0.4 miles; Northeastern University about 0.5 miles | The Chester: Penthouse One Bedroom |
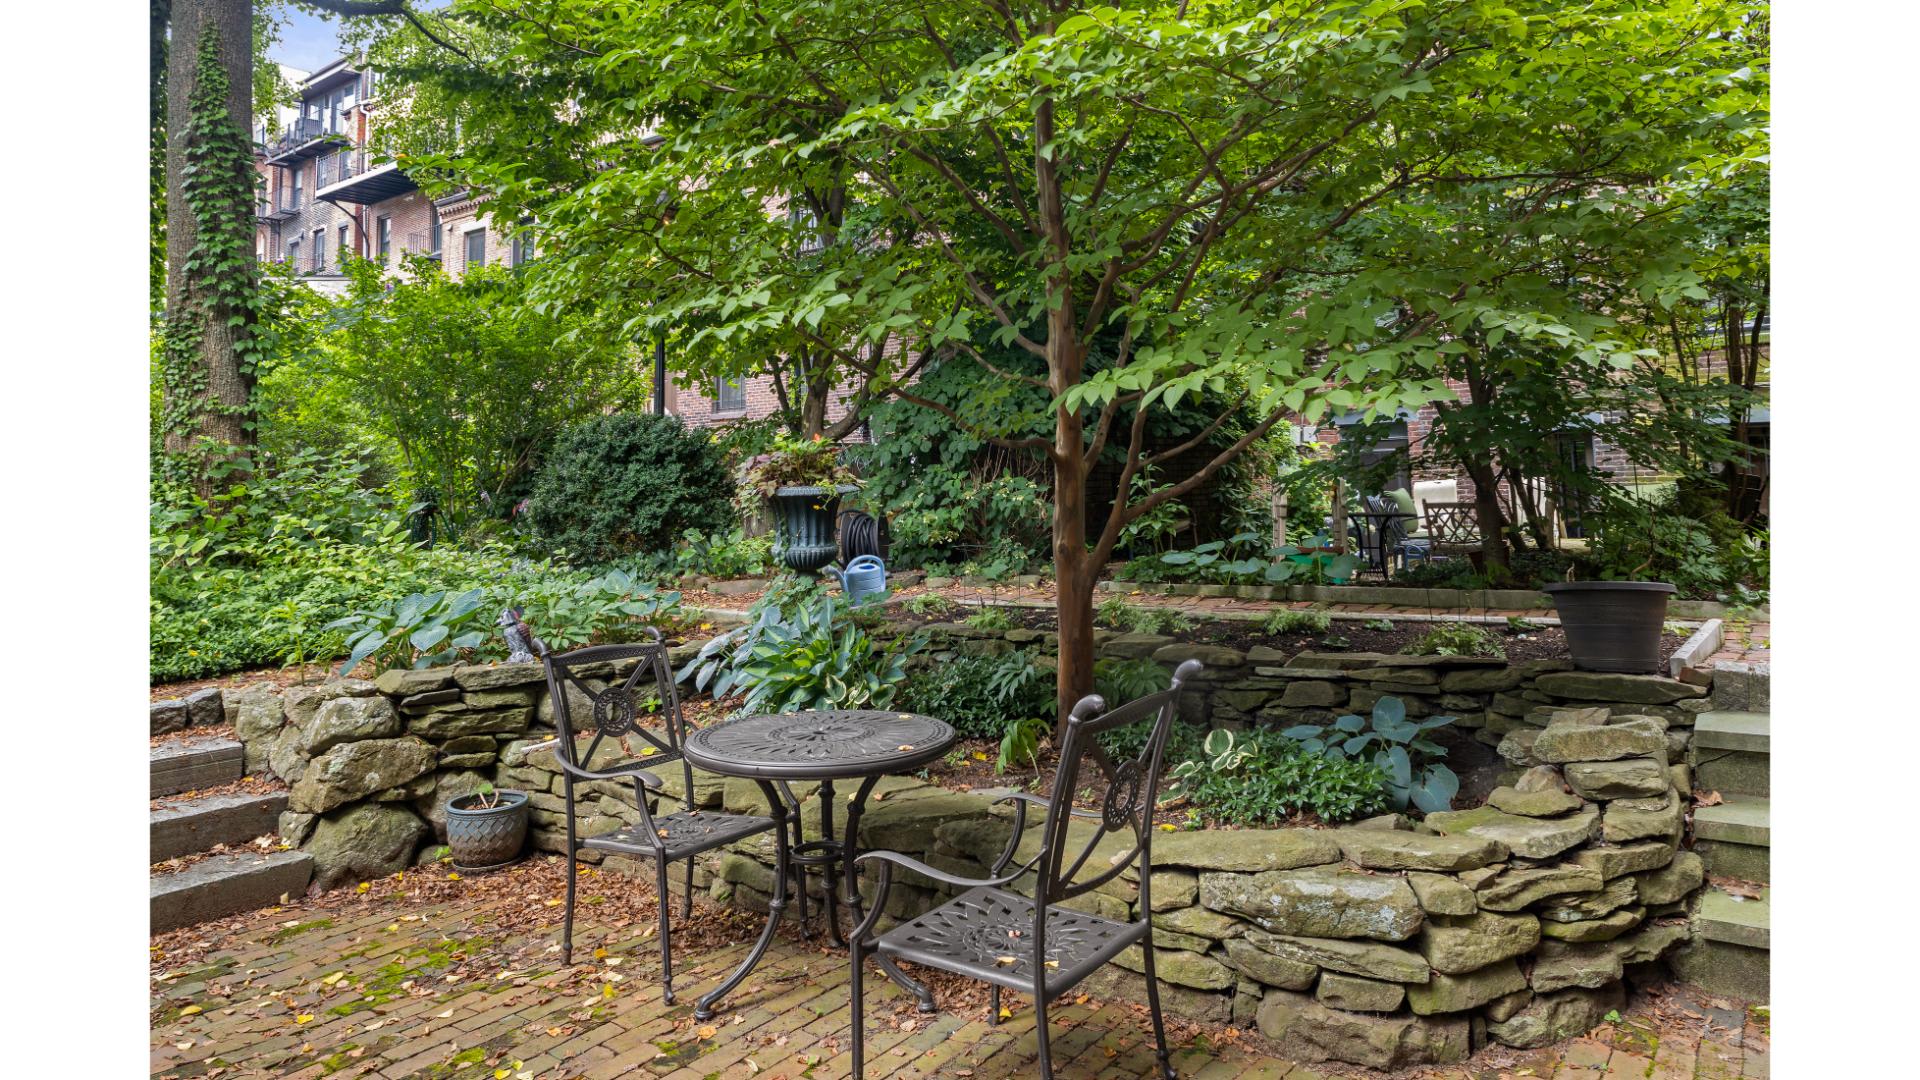
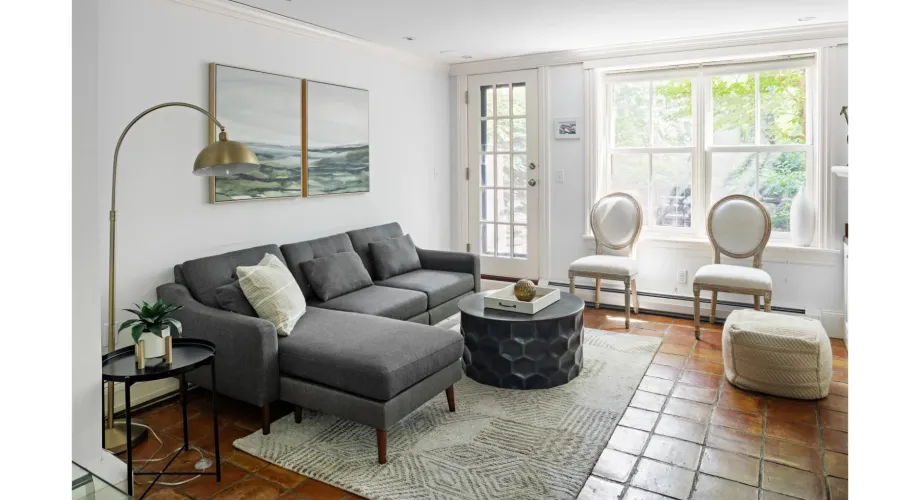
| South End, Montgomery Park | Copley Square about 0.5 miles | Enjoy Boston, Private Patio On Montgomery Park |
| Jamaica Plain | Jamaica Pond, the Arnold Arboretum, Longwood Medical Area access, the T | Walk to T, Jamaica Pond, Dining & Whole Foods |
| Cambridge, Central Square | Harvard Square about 0.8 miles; Kendall Square about 1.1 miles | Inviting 3BR In Cambridge, Walk To T & Central Sq |
| Gloucester | Good Harbor Beach, within walking distance | Walk To Good Harbor, Ocean Views, Open All Year |
Use the table as a method, not a benchmark: pick the nearest anchors, then compare same-size listings in the same neighborhood. Gloucester behaves differently from the city. A family house there competes mostly with other whole-house stays rather than rooms. You can browse our Boston stays and our Gloucester stay to see how each setting is presented.
Is Short-Term Renting Legal in Boston, and What Taxes Apply?
Boston short-term rental regulation is a city registration and eligibility system that decides which units may be rented to guests and under what conditions. The City of Boston’s short-term rentals page is the authoritative source. The ordinance classifies units and requires annual registration. It also limits which properties qualify, including owner-occupancy conditions for some unit types. A 2026 City of Boston oversight hearing order shows the city is still reviewing how licensing, residency, and operating conditions work in practice.
Rules stop at the city line. Cambridge runs its own process through the city’s Inspectional Services Department. Brookline applies primary-residence and day-limit rules that suit professionally managed rentals poorly, and we do not currently manage Brookline properties. Gloucester has its own requirements, so check the City of Gloucester’s official site before listing a Cape Ann home.
Taxes sit on top of registration. Massachusetts charges a room occupancy excise; the state’s page cites a 5.7% rate and a convention-center surcharge in Cambridge, and local charges vary by municipality. Register and remit through MassTaxConnect, and confirm current rates before you set a nightly price.
Rules change by city and by year, so South End Hospitality Rental Management helps owners understand and stay on top of registration requirements for their specific municipality. We are not a substitute for legal or tax advice; confirm details with the city and a qualified professional.
Does Short-Term Rental Beat Long-Term Rent for Boston Investors?
A short-term versus long-term yield comparison weighs gross revenue against the work and volatility that come with each strategy. Regulatory exposure belongs in that weighing too. Commercial brokerage data puts Boston multifamily asking rent near $3,000 per unit with vacancy around 6% as of mid-2026. Twelve months of that rent is roughly $36,000 before vacancy, which sits above the short-term average in the snapshot table.
The two averages measure different unit mixes, though. About two thirds of short-term listings are one-bedrooms, while multifamily rent blends every size. Compare like for like before you trust either headline.
Conversions from long-term to short-term typically lift gross rental revenue by 30% to 70%, but operating costs and management intensity rise too. Gross is the wrong finish line. Net after cleaning, linens, platform fees, taxes, and management is the number that matters.
| Criteria | Short-term | Mid-term (30 to 90 days) | Long-term |
|---|---|---|---|
| Revenue pattern | Largest swings, tied to events and seasons | Steadier; can fill winter gaps | Fixed monthly rent |
| Daily workload | Turnovers, guest messages, pricing | Lighter than short-term | Lowest |
| Regulatory exposure | Registration, excise tax, eligibility rules | Depends on how stay length is classified | Landlord-tenant rules |
| Best fit | Units near demand anchors | Medical, academic, and corporate stays | Owners who want hands-off income |
Our view: if you own one unit nearby and enjoy hosting, self-managing can work. Once you travel often or add a second unit, a team handling revenue management and 24/7 guest support changes the math. Housekeeping and maintenance do as well. Our full-service management overview explains how those pieces connect. Management fees vary by property and location. Scope of service and portfolio size also shift them.
What Could Change for Boston Vacation Rentals in 2026?
The 2026 Boston outlook is a read on demand drivers and constraints, not a guarantee. Domestic visitors to the Boston region stay a little over three days on average. That short stay is why minimum-night rules deserve scrutiny.
The City of Boston’s FY27 report identifies the 2026 FIFA World Cup and U.S. 250th-anniversary events as potential tourism boosts. It also counts 95 hotels with 24,100 rooms in establishments of 50 or more rooms as of January 2026, and reports hotel occupancy held at 77.7% in 2026. Hotels compete for the same event weekends you do, so their pricing affects your nights. Confirm match and event schedules with the organizers before you price any date.
On the constraint side, supply is shrinking while RevPAR softened. That combination suggests rate pressure rather than a flood of new listings. Watch city oversight of the ordinance as well.
Because we also operate boutique and limited-service hotels, we track hotel occupancy as closely as vacation rental data. If you are weighing a small hotel, read how we approach hotel management.
Where Can You Buy or Build a Boston Vacation Rental Market Report?
A Boston vacation rental market report comes from free public sources or paid listing-data providers. It can also come from custom analysis by an operator. Free sources include the City of Boston’s FY27 report, the regional tourism bureau’s visitor data, and the Massachusetts seasonal-homes report. Paid providers such as AirDNA publish Boston market pages. Pricing and access tiers change, and so do download formats, so confirm them on each provider’s site.
Whatever you buy, run it through this checklist:
- Confirm the geography: Boston city or Greater Boston.
- Confirm the reporting window, and whether figures are trailing twelve months or a single month.
- Check which platforms are included, such as Airbnb and Vrbo.
- Ask how active listings are defined and whether figures are means or medians.
- Request cuts by bedroom count and neighborhood before you rely on a citywide average.
Skip any report that cannot answer the first two items. If you are weighing a Boston-area purchase or a new launch, South End Hospitality Rental Management can help. It offers STR consulting and advisory for owners at the planning stage, informed by the properties we operate in Boston, Cambridge, and Gloucester.
Frequently Asked Questions
What is Boston’s average vacation rental occupancy rate?
AirDNA’s trailing-year figure for the city sits in the low 60s percent, and the snapshot table shows the exact number. Greater Boston figures are higher, around the mid 60s for 2026, because the geography is wider.
What is the average nightly rate for Boston short-term rentals?
AirDNA’s citywide ADR is the figure in the snapshot table, and it covers all listing types. Entire homes earn more than shared or private rooms, so compare your unit only against entire-home listings with the same bedroom count.
How seasonal is Boston’s vacation rental demand?
Demand peaks in July and August and holds up through October. It is weakest from November through February, with January the lowest month. Event weekends can lift individual dates inside the slow months.
How can I buy a Boston vacation rental market report?
Start with the free city and state sources. Then compare paid providers on geography and window, and on how each defines a listing. If you need neighborhood or bedroom-level cuts, ask the provider whether they are included or sold separately. South End Hospitality Rental Management also offers STR consulting for owners at the planning stage.
Do I need to register a short-term rental in Boston?
Boston has its own registration and eligibility rules, published on the City of Boston’s short-term rentals page. Cambridge, Brookline, and Gloucester use separate rules, so never apply one city’s requirements to another. Massachusetts also requires registration for the room occupancy excise.
How are management fees determined?
Management fees vary by property and location. Scope of service and portfolio size also shift them. Talk through your property with our team to see which scope fits, from full-service management to co-hosting.
Does South End Hospitality manage hotels as well as vacation rentals?
Yes. We manage boutique and limited-service hotels as well as vacation rentals across Greater Boston and select North Shore communities. You can read more on our hotel management page.
Conclusion: Using the 2026 Boston Vacation Rental Data
A vacation rental market report Boston owners can trust names its geography and window for every figure. It names the source too. The 2026 pattern is consistent: supply is down, RevPAR is softer, occupancy holds in the low 60s, and winter is the weak stretch. Start with the city’s registration page, confirm your tax setup, and compare your unit with same-size listings in the same neighborhood. Event-driven demand from the World Cup and U.S. 250th-anniversary programming may help, but price only confirmed dates.

To see how a South End stay fits the demand picture above, The Chester: Penthouse One Bedroom puts you within about 0.4 miles of Symphony Hall. Check availability here. Owners who want a hands-on local team can reach South End Hospitality Rental Management through our website.
Content powered by inkSTR.co