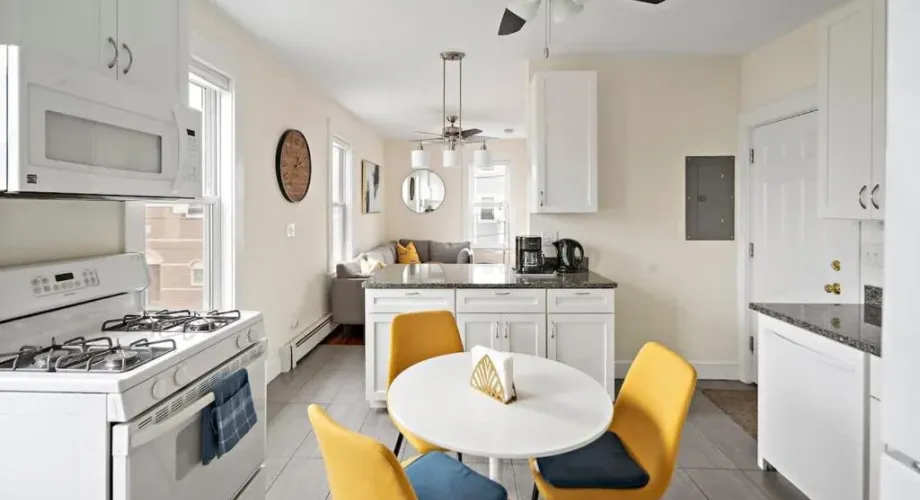
STR Market Analysis Cambridge: 7 Data Points for Owners
A Cambridge STR market analysis measures how many short-term rentals operate in the city. It tracks how they perform on occupancy, average daily rate (ADR), RevPAR, and revenue. Then it checks those numbers against the city’s licensing rules. At South End Hospitality Rental Management, we manage properties in Cambridge and Boston, so we read these figures as operators. Treat any single dataset as an estimate, and always note its provider and date.
Key Takeaways
- A Cambridge STR market analysis tracks supply, occupancy, ADR, RevPAR, and revenue; each data provider defines an active listing differently, so always label the source and period.
- AirDNA reported Cambridge active listings up 8.8% year over year through May 2026, while Boston’s active supply fell 4.3% through June 2026.
- Cambridge revenue and occupancy grew over the same window, but ADR and RevPAR softened, which signals rate pressure.
- Entire homes made up 55.2% of Cambridge listings and one-bedroom units 66.3%, so unit type changes which benchmark applies to you.
- The City of Cambridge Inspectional Services Department licenses rentals under 30 days, and city counts of registered units sit well below platform-tracked supply.
- Use the data to set pricing and minimum-stay rules, and confirm licensing and tax steps with official sources before you list.
In 2026, Cambridge hosts and investors can pull numbers from AirDNA, AirROI, and city records, and the three rarely agree. The gap comes from each source using its own definition of an active listing and its own observation window. A headline figure without a date and a provider is close to useless for underwriting.
This list covers seven questions we hear from Cambridge owners, from what the metrics mean to what to do with them. Each pick is chosen because it changes a pricing or licensing decision, not because it makes a tidy chart.
We run vacation rentals and boutique hotels across Greater Boston, and Cambridge behaves differently from Back Bay or the South End. Academic calendars and a heavy one-bedroom mix shape results, as does a licensing system run by the city’s Inspectional Services Department.
1. What Does a Cambridge STR Market Analysis Measure?
A Cambridge STR market analysis is a structured review of local short-term rental supply and performance, built from platform data such as Airbnb and Vrbo listings. It reports five core metrics: active listings, occupancy, ADR, RevPAR, and annual revenue per listing. Together they show how crowded the market is and how much a typical unit earns.
Occupancy is the share of available nights that were booked. ADR is the average rate earned on booked nights. RevPAR multiplies the two, which makes it the fairest single figure for comparing a high-rate, low-occupancy unit with a low-rate, high-occupancy one.
Score components worth reading
AirDNA also publishes composite scores. It assigns Cambridge a Market Score of 74 on a 40-to-100 scale, with a Rental Demand score of 94 and a Seasonality score of 74. Treat these as directional. They compress several inputs into one number, and the inputs matter more than the label.
Pro tip: filter before you benchmark
A citywide average blends private rooms with entire homes and one-bedrooms with five-bedroom houses. If you own an entire one-bedroom, benchmark against that slice only. We start every pricing review that way, because a blended average will mislead you in either direction.
2. Which Data Provider Should You Trust for Cambridge?
A short-term rental data provider is a company that scrapes or licenses platform listings and models occupancy and revenue from them. For Cambridge, AirDNA and AirROI are the two sources most owners will meet, and their estimates differ because their definitions and windows differ.
| Source | Period | Listings | Occupancy | ADR |
|---|---|---|---|---|
| AirDNA Cambridge overview | Trailing 12 months, May 2026 | 1,690 active | 67% | $240 |
| AirROI Cambridge page | Past year | Not stated | Booked 50% of nights open | $289 |
| AirROI figures, secondary report | Year ending March 2026 | 738 tracked | 52% | $239 |
The spread is wide. AirDNA counts more listings and reports higher occupancy, while AirROI’s “booked nights while open” measure lands closer to half. Neither is wrong; they answer slightly different questions.
Our position: use AirDNA for supply and trend direction, use AirROI as a cross-check on occupancy and rate, and treat the city’s own registration counts as the legal baseline. Averaging the three into one number hides the very differences you need to understand.
3. How Did Cambridge Perform Compared With Boston in 2026?
Cambridge short-term rental performance in 2026 shows growing supply and softening rates, while Boston shows shrinking supply and mixed revenue. AirDNA reports that Cambridge revenue rose 19.0% and occupancy rose 3.6% from May 2026 to May 2026, yet ADR fell 1.8% and RevPAR fell 4.8%.
| Metric | Cambridge (AirDNA, May 2026) | Boston (AirDNA, June 2026) |
|---|---|---|
| Active listings | 1,690 | 3,326 |
| Listing change, year over year | Up 8.8% | Down 4.3% |
| Occupancy | 67% | 62% |
| ADR | $240 | $332 |
| Annual revenue per listing | $26.8K | $33,700 |
Read this table with care. The reporting months differ by one, and each city’s regulatory regime is its own. A Boston short-term rental data overview from AirDNA uses a different sample than its Cambridge page, so the gap in ADR partly reflects what each tracked market contains.
A peer-reviewed study of Boston estimated that listings fell by roughly 57% after the city’s regulations and enforcement, with a gradual rebound among professionally managed entire-home listings. Cambridge has not seen that kind of contraction in the AirDNA numbers, which is one reason we never apply Boston conclusions to Cambridge units.
4. What Does the Cambridge Listing Mix Tell You?
The Cambridge listing mix is the breakdown of local supply by property type, bedroom count, booking channel, availability, and minimum stay. AirDNA reports that 55.2% of Cambridge listings are entire homes, 42.7% are private rooms, and 2.1% are shared rooms.
Bedroom count is even more concentrated. One-bedroom units account for 66.3% of listings, two-bedrooms for 19.8%, and three-bedrooms for 9.5%. If you own a three-bedroom, you compete in a thin segment, which can mean fewer comparable listings and more pricing power for groups and families.
Channel and stay-length patterns
Meanwhile, 54.3% of listings carry a minimum stay of 30 nights or more, which points to a market leaning on academic and medical stays. We list across Airbnb, Vrbo, Booking.com, Expedia, and a direct-booking site because single-channel supply leaves reach on the table.
Availability tells you who is serious
About 52% of listings are available 271 to 365 nights a year. Units open only a fraction of the year pull averages around, so filter them out when you compare yourself with full-time operators.
5. How Do You Register a Short-Term Rental in Cambridge, MA?
Short-term rental registration in Cambridge is the licensing process run by the city’s Inspectional Services Department for units rented to a single tenant for less than 30 consecutive days. The City of Cambridge Open Data Portal uses the same under-30-days definition, so a 30-night stay falls outside it.
Start with the city’s short-term rental registration page and its Short-Term Rental Guide. Confirm your unit’s eligibility before you list. We do not restate eligibility terms here. They change, and a summary can go stale.
Registered versus tracked supply
This is where most market analyses go quiet. The Boston.com reported that a City Solicitor memo found fewer than 30% of 635 likely units registered as of July 2026. A Planning Board meeting cited roughly 716 units, of which 216 were registered. Platform data therefore includes supply that may not be licensed, and that affects both competition and your own risk.
Tax and Boston contrast
State lodging tax may also apply. The Massachusetts room occupancy excise tax page lists current rates, and hosts register through MassTaxConnect. Boston runs a separate program, described on the City of Boston short-term rentals page. Never cross-apply one city’s rules to the other, and consult a tax professional or attorney for your situation.
6. What Drives Seasonality and Demand in Cambridge?
Cambridge rental demand is the booking pressure created by universities and hospitals, with Greater Boston tourism layered on top. Harvard, MIT, Boston University, and Northeastern all pull visitors around move-in, parents’ weekends, and graduation, and AirDNA’s Cambridge seasonality score of 74 reflects a market with real calendar swings.
Tourism adds a second layer. Boston draws tens of millions of domestic visitors a year, and their average stay is short. That pattern fits the entire-home, shorter-booking guests who choose a Cambridge apartment as a base.
How proximity shapes the listing
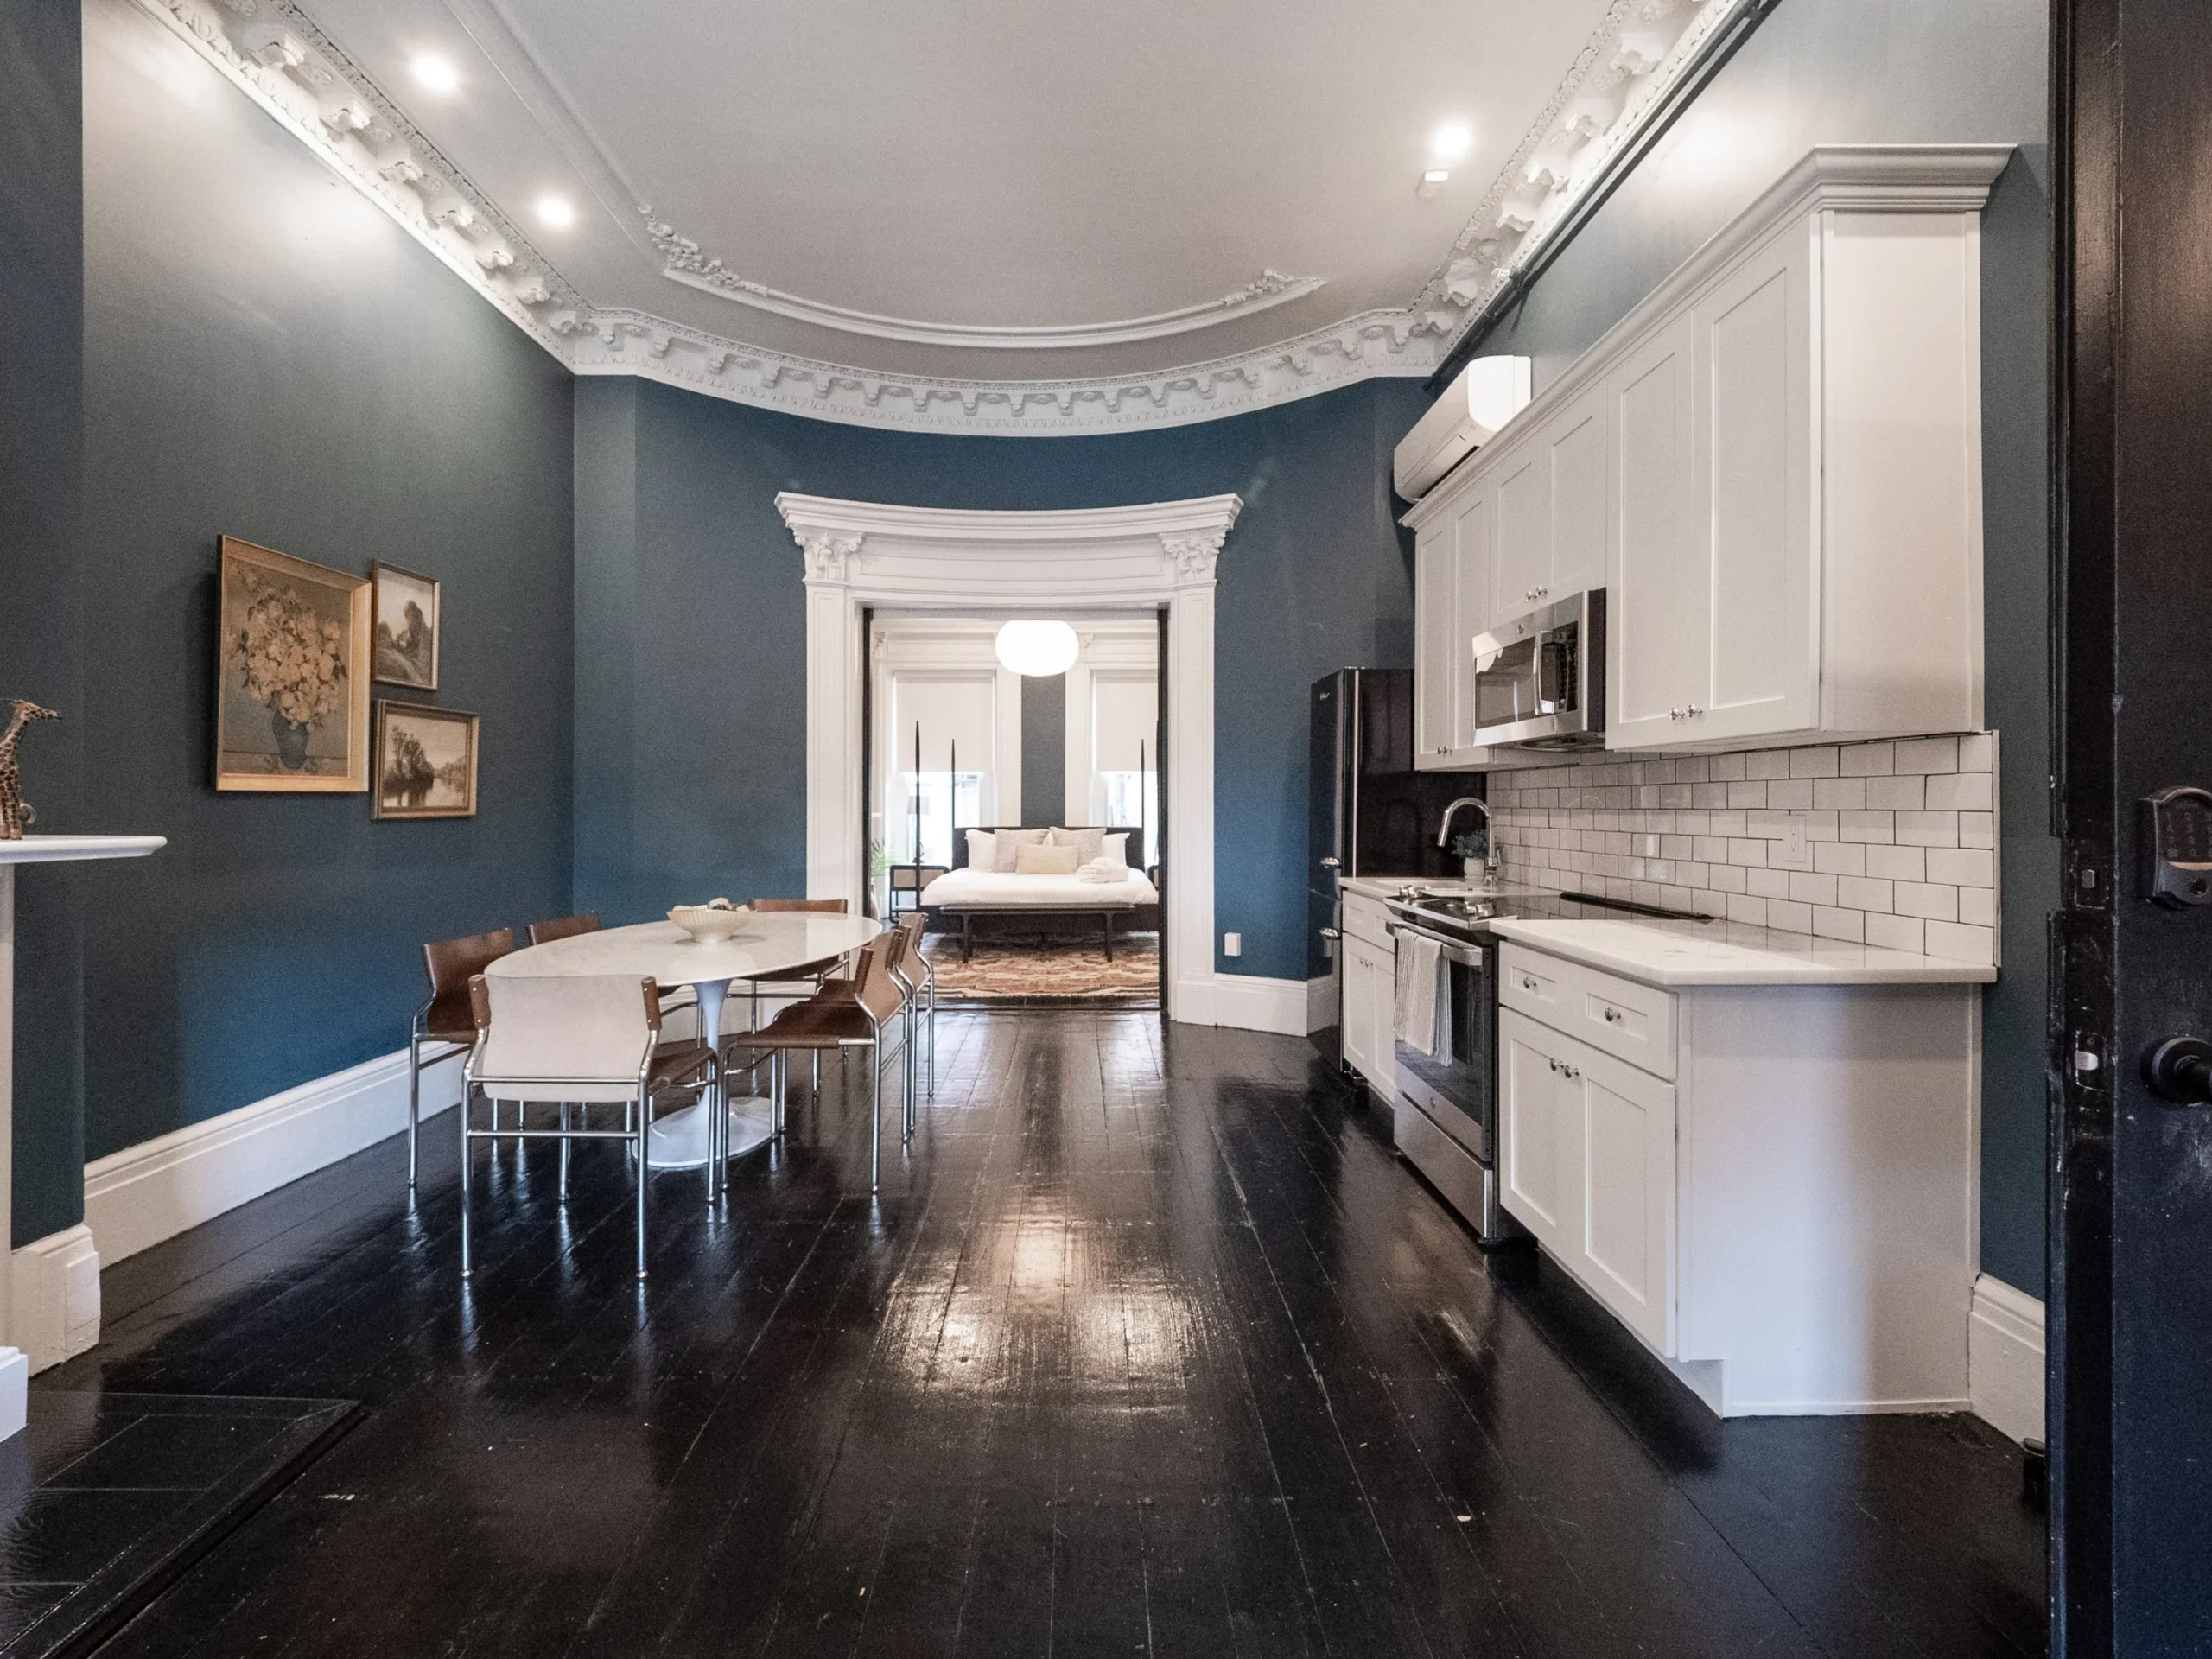
Inviting 3BR In Cambridge, Walk To T & Central Sq sleeps 7 and sits about 0.8 miles from Harvard Square (roughly a 20-minute walk) and about 1.1 miles from Kendall Square (roughly a 5-minute drive, estimated). Those distances belong in the listing copy, because visiting academics and families search by them.
Be honest about the building
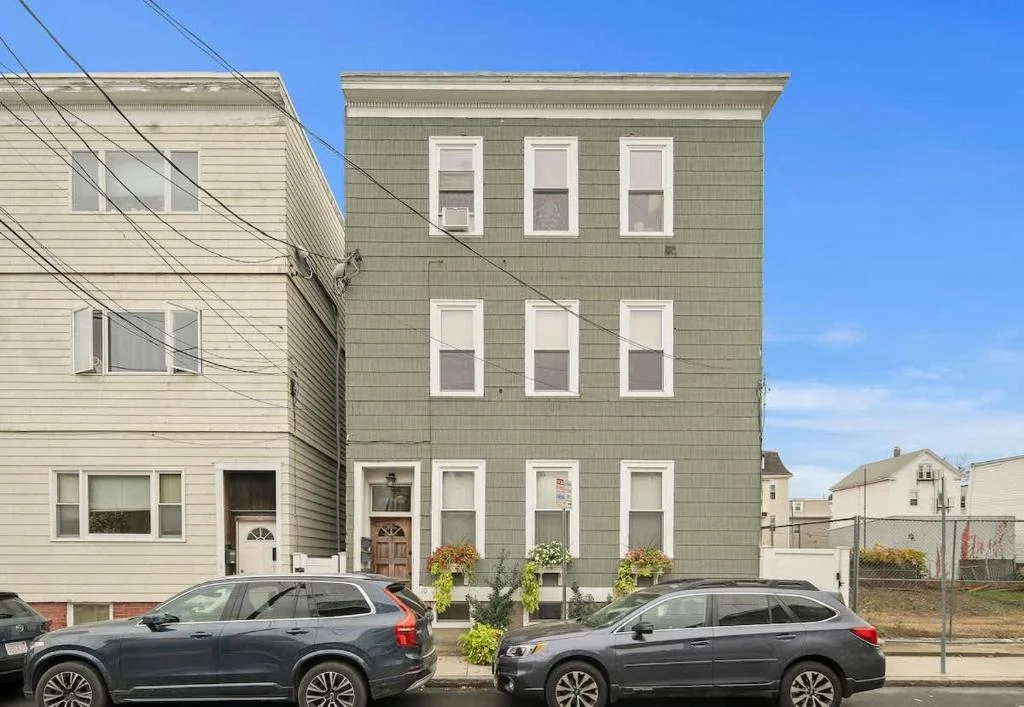
10 Porter Street, a unit in a classic Cambridge triple-decker, has 3 exterior steps and one flight of interior stairs. It has no elevator, and its clawfoot tub has a high side. Disclosing these details up front costs a few bookings and protects reviews. Our revenue manager then prices around academic dates and booking pace rather than a fixed nightly rate, and local events factor in as well.
7. How Should Owners Act on the Numbers?
Acting on STR market data means turning benchmarks into decisions about nightly rate and minimum stay, plus who runs operations. Start from your unit type, not the citywide average, and revisit all three each season.
- Pull your unit-type benchmark from at least two providers and note each date window.
- Confirm registration status with the Inspectional Services Department before you publish.
- Set a rate floor and a weekday and weekend structure, then adjust around the academic calendar.
- Decide on minimum stays; with so many 30-night listings, a mid-term option can fill gaps between peak weeks.
- Review ADR and RevPAR together, not occupancy alone, since Cambridge rates softened while occupancy rose.
| Approach | Pricing and guest messages | Turnovers and maintenance | Best fit |
|---|---|---|---|
| Self-manage | You handle both | You coordinate | One nearby unit and time to spare |
| Co-host | Shared, defined by agreement | Shared, defined by agreement | Owners who want to stay involved |
| Full-service | Dedicated revenue manager and 24/7 support | Integrated housekeeping, linen, and maintenance | Owners who are remote or adding units |
We also manage boutique and limited-service hotels, and hotel operators benchmark differently. Our hotel management approach uses the same pricing discipline as our full-service management for rentals.
Frequently Asked Questions
It depends on the provider. AirROI reports $289 over the past year, while AirDNA’s trailing-12-month figure is lower because of different listing definitions. Compare your own unit type, since entire one-bedrooms price differently from private rooms.
What are Cambridge, MA short-term rental occupancy rates?
AirDNA reports higher occupancy than AirROI, which measures bookings against nights a listing was open and lands near half. Neither figure covers a single unit’s results, so use them as a range, then adjust for building type and season.
How do I register a short-term rental in Cambridge, MA?
The City of Cambridge Inspectional Services Department licenses rentals under 30 consecutive days. Use the city’s registration page and Short-Term Rental Guide, and confirm eligibility first. Then ask about state lodging tax registration through MassTaxConnect.
What is the best short-term rental analytics tool for Cambridge?
South End Hospitality Rental Management relies on a dedicated revenue manager rather than a single tool. That person watches seasonality and local events, with booking pace alongside. For independent benchmarking, AirDNA and AirROI both publish Cambridge market pages; compare them side by side and note the dates.
Does South End Hospitality manage hotels as well as vacation rentals?
Yes. We manage boutique and limited-service hotels alongside vacation rentals across Greater Boston and select North Shore communities. You can read about it on our hotel management page.
How are management fees determined?
Management fees vary by property and location. Scope of service and portfolio size also matter.
Do Boston and Cambridge follow the same rules?
No. Each city runs its own registration program, so check the municipal source for the address you own. Boston’s program sits with its Inspectional Services Department, and Cambridge’s is run by its own.
Conclusion
A reliable STR market analysis in Cambridge starts with labeled data: the provider, the date window, and what counts as an active listing. Supply has grown in 2026, while rates and RevPAR have softened, and the city’s registered inventory is smaller than platform-tracked supply. Benchmark your own unit type, confirm licensing with the city, and revisit pricing each season.
Looking ahead, expect Cambridge enforcement and data to keep evolving, so recheck both before each new year. If you want a second set of eyes, our team in Greater Boston is glad to help.
Want a hands-on local team to run your Cambridge or Boston property with pricing built on real market data? Contact South End Hospitality Rental Management to talk through your situation.
Content powered by inkSTR.co